Contact Info
Rabies Statistics
Charts
All animals tested for rabies in Minnesota are submitted by people who have chosen to have the animal tested. There is no random sampling of wild animals for rabies testing in Minnesota. For that reason, these statistics do not reflect the true infection levels of animals in the wild.
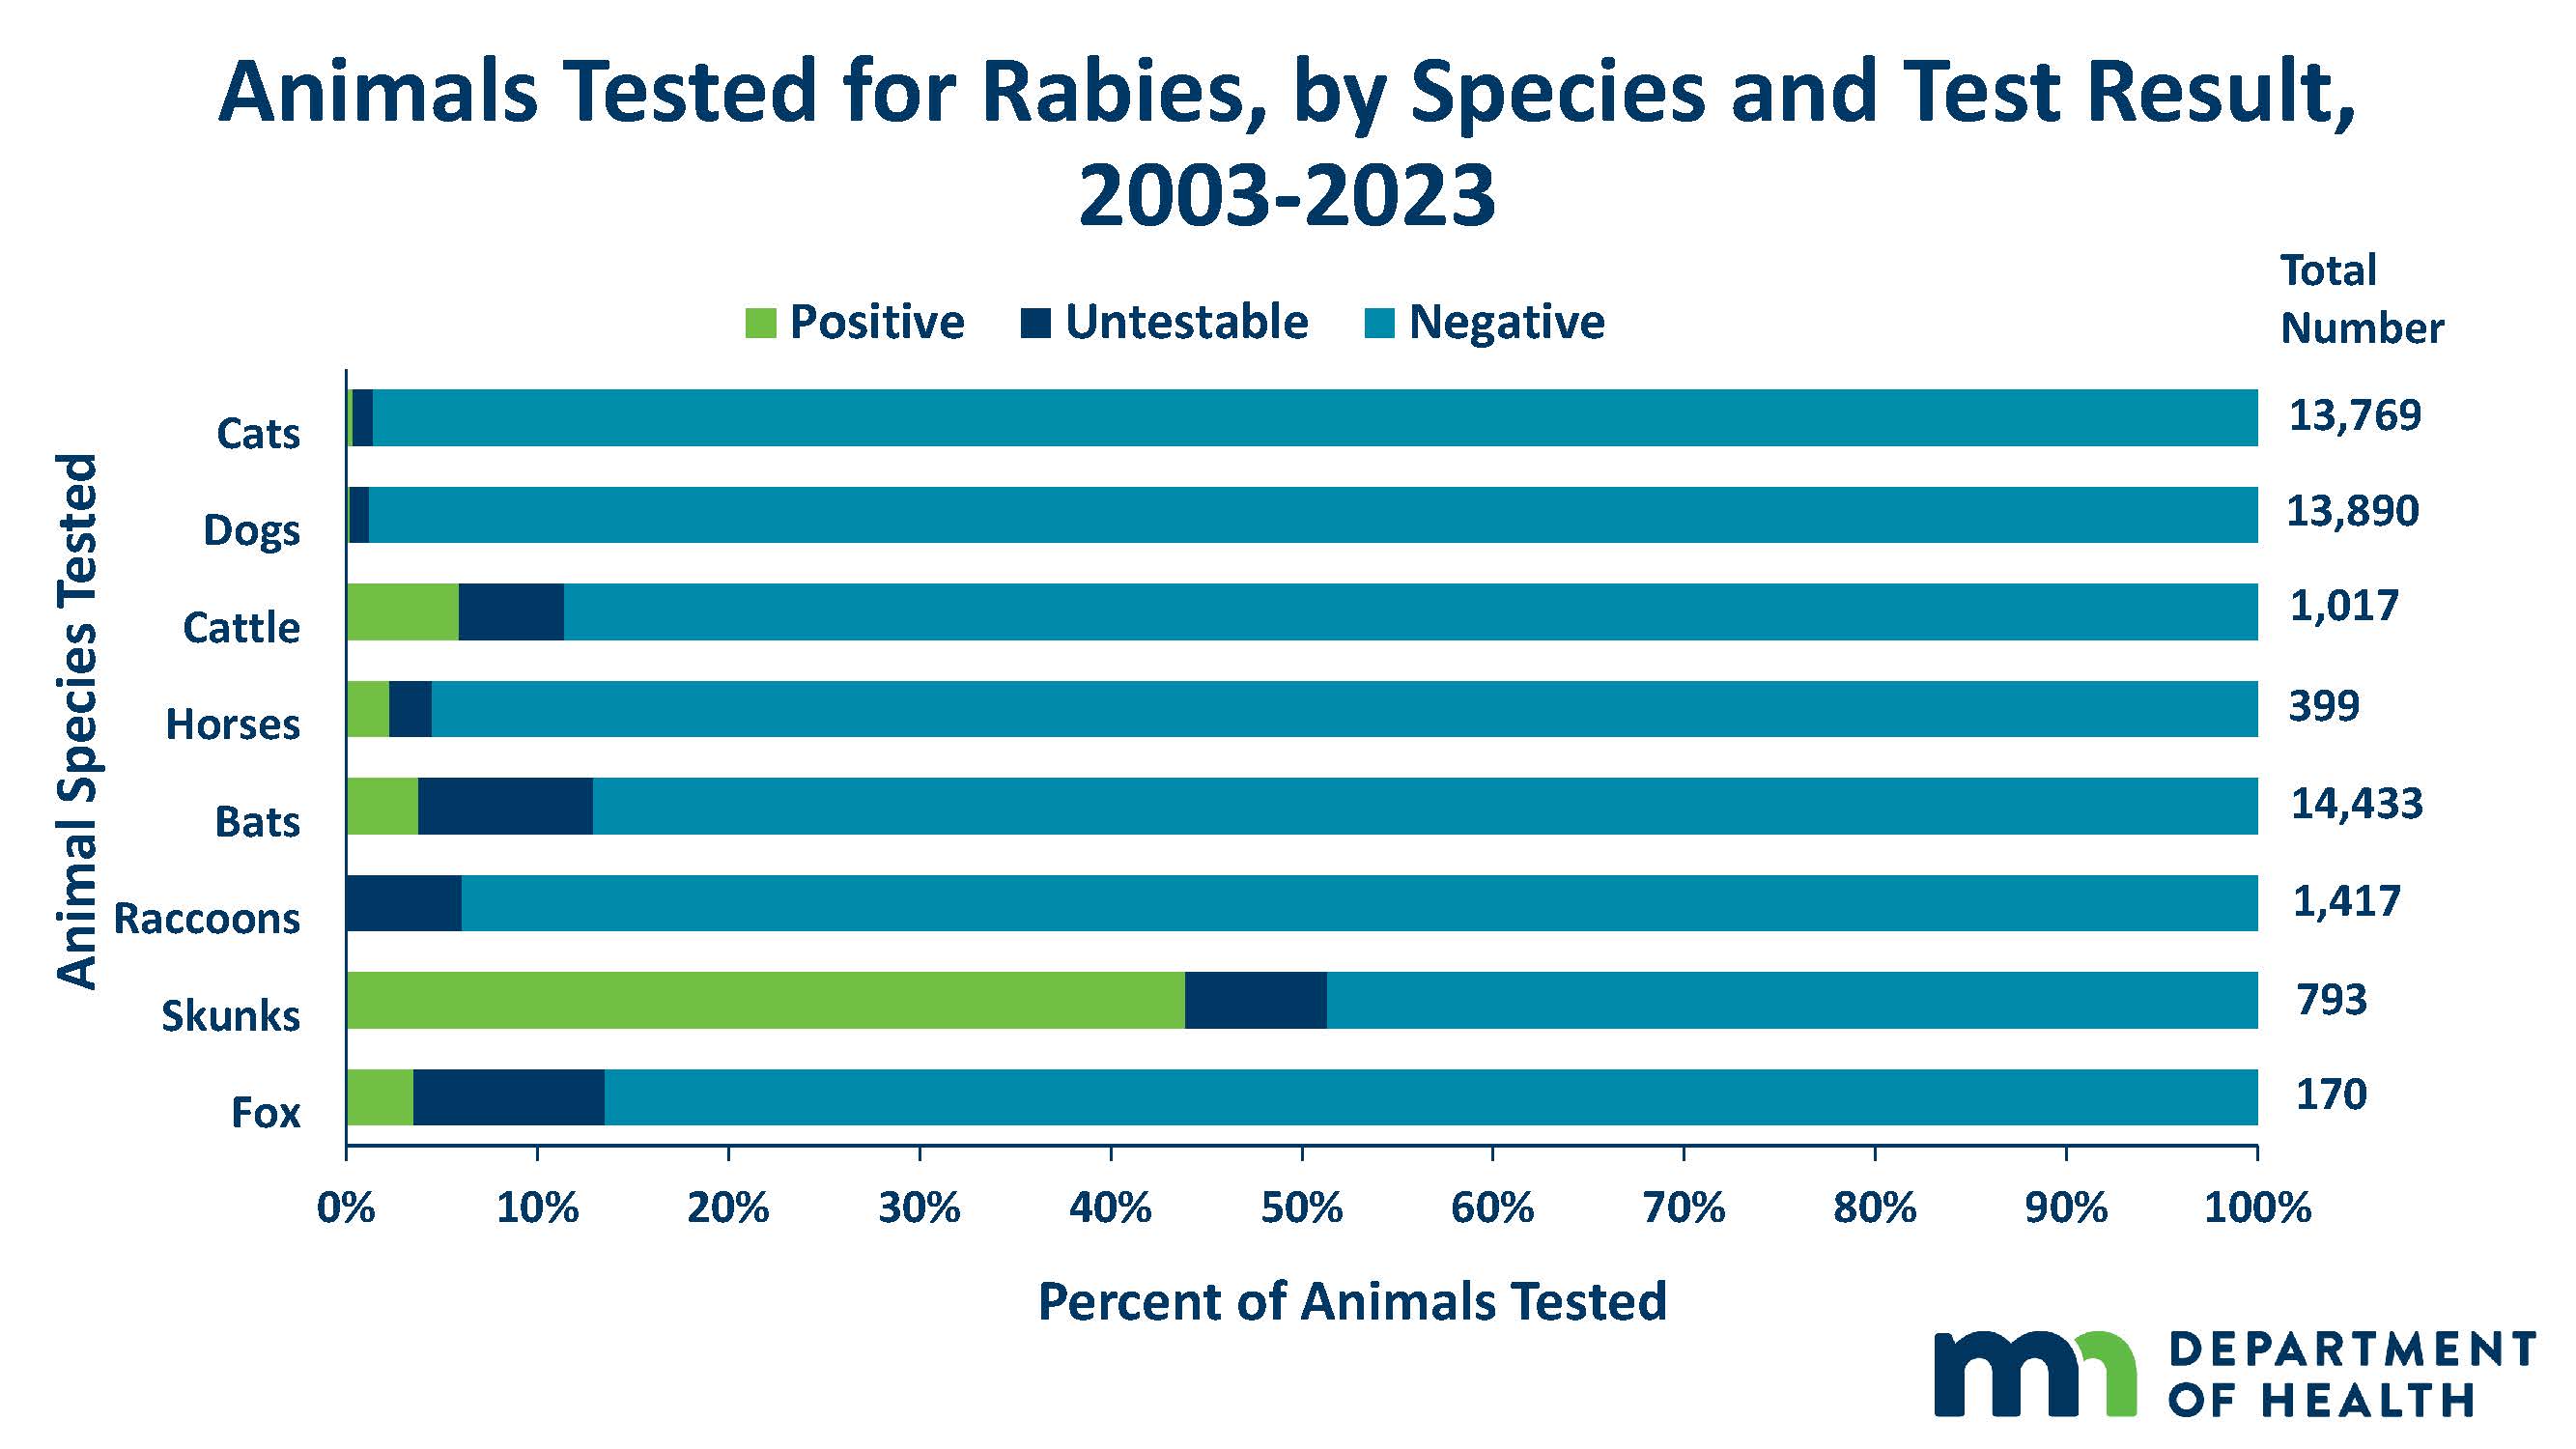 | Animals Tested for Rabies, by Species and Test Result, Minnesota, 2016-2025 (PDF) The majority of animals that we test are negative for rabies, except for skunks. Nearly half of the skunks tested have rabies. |
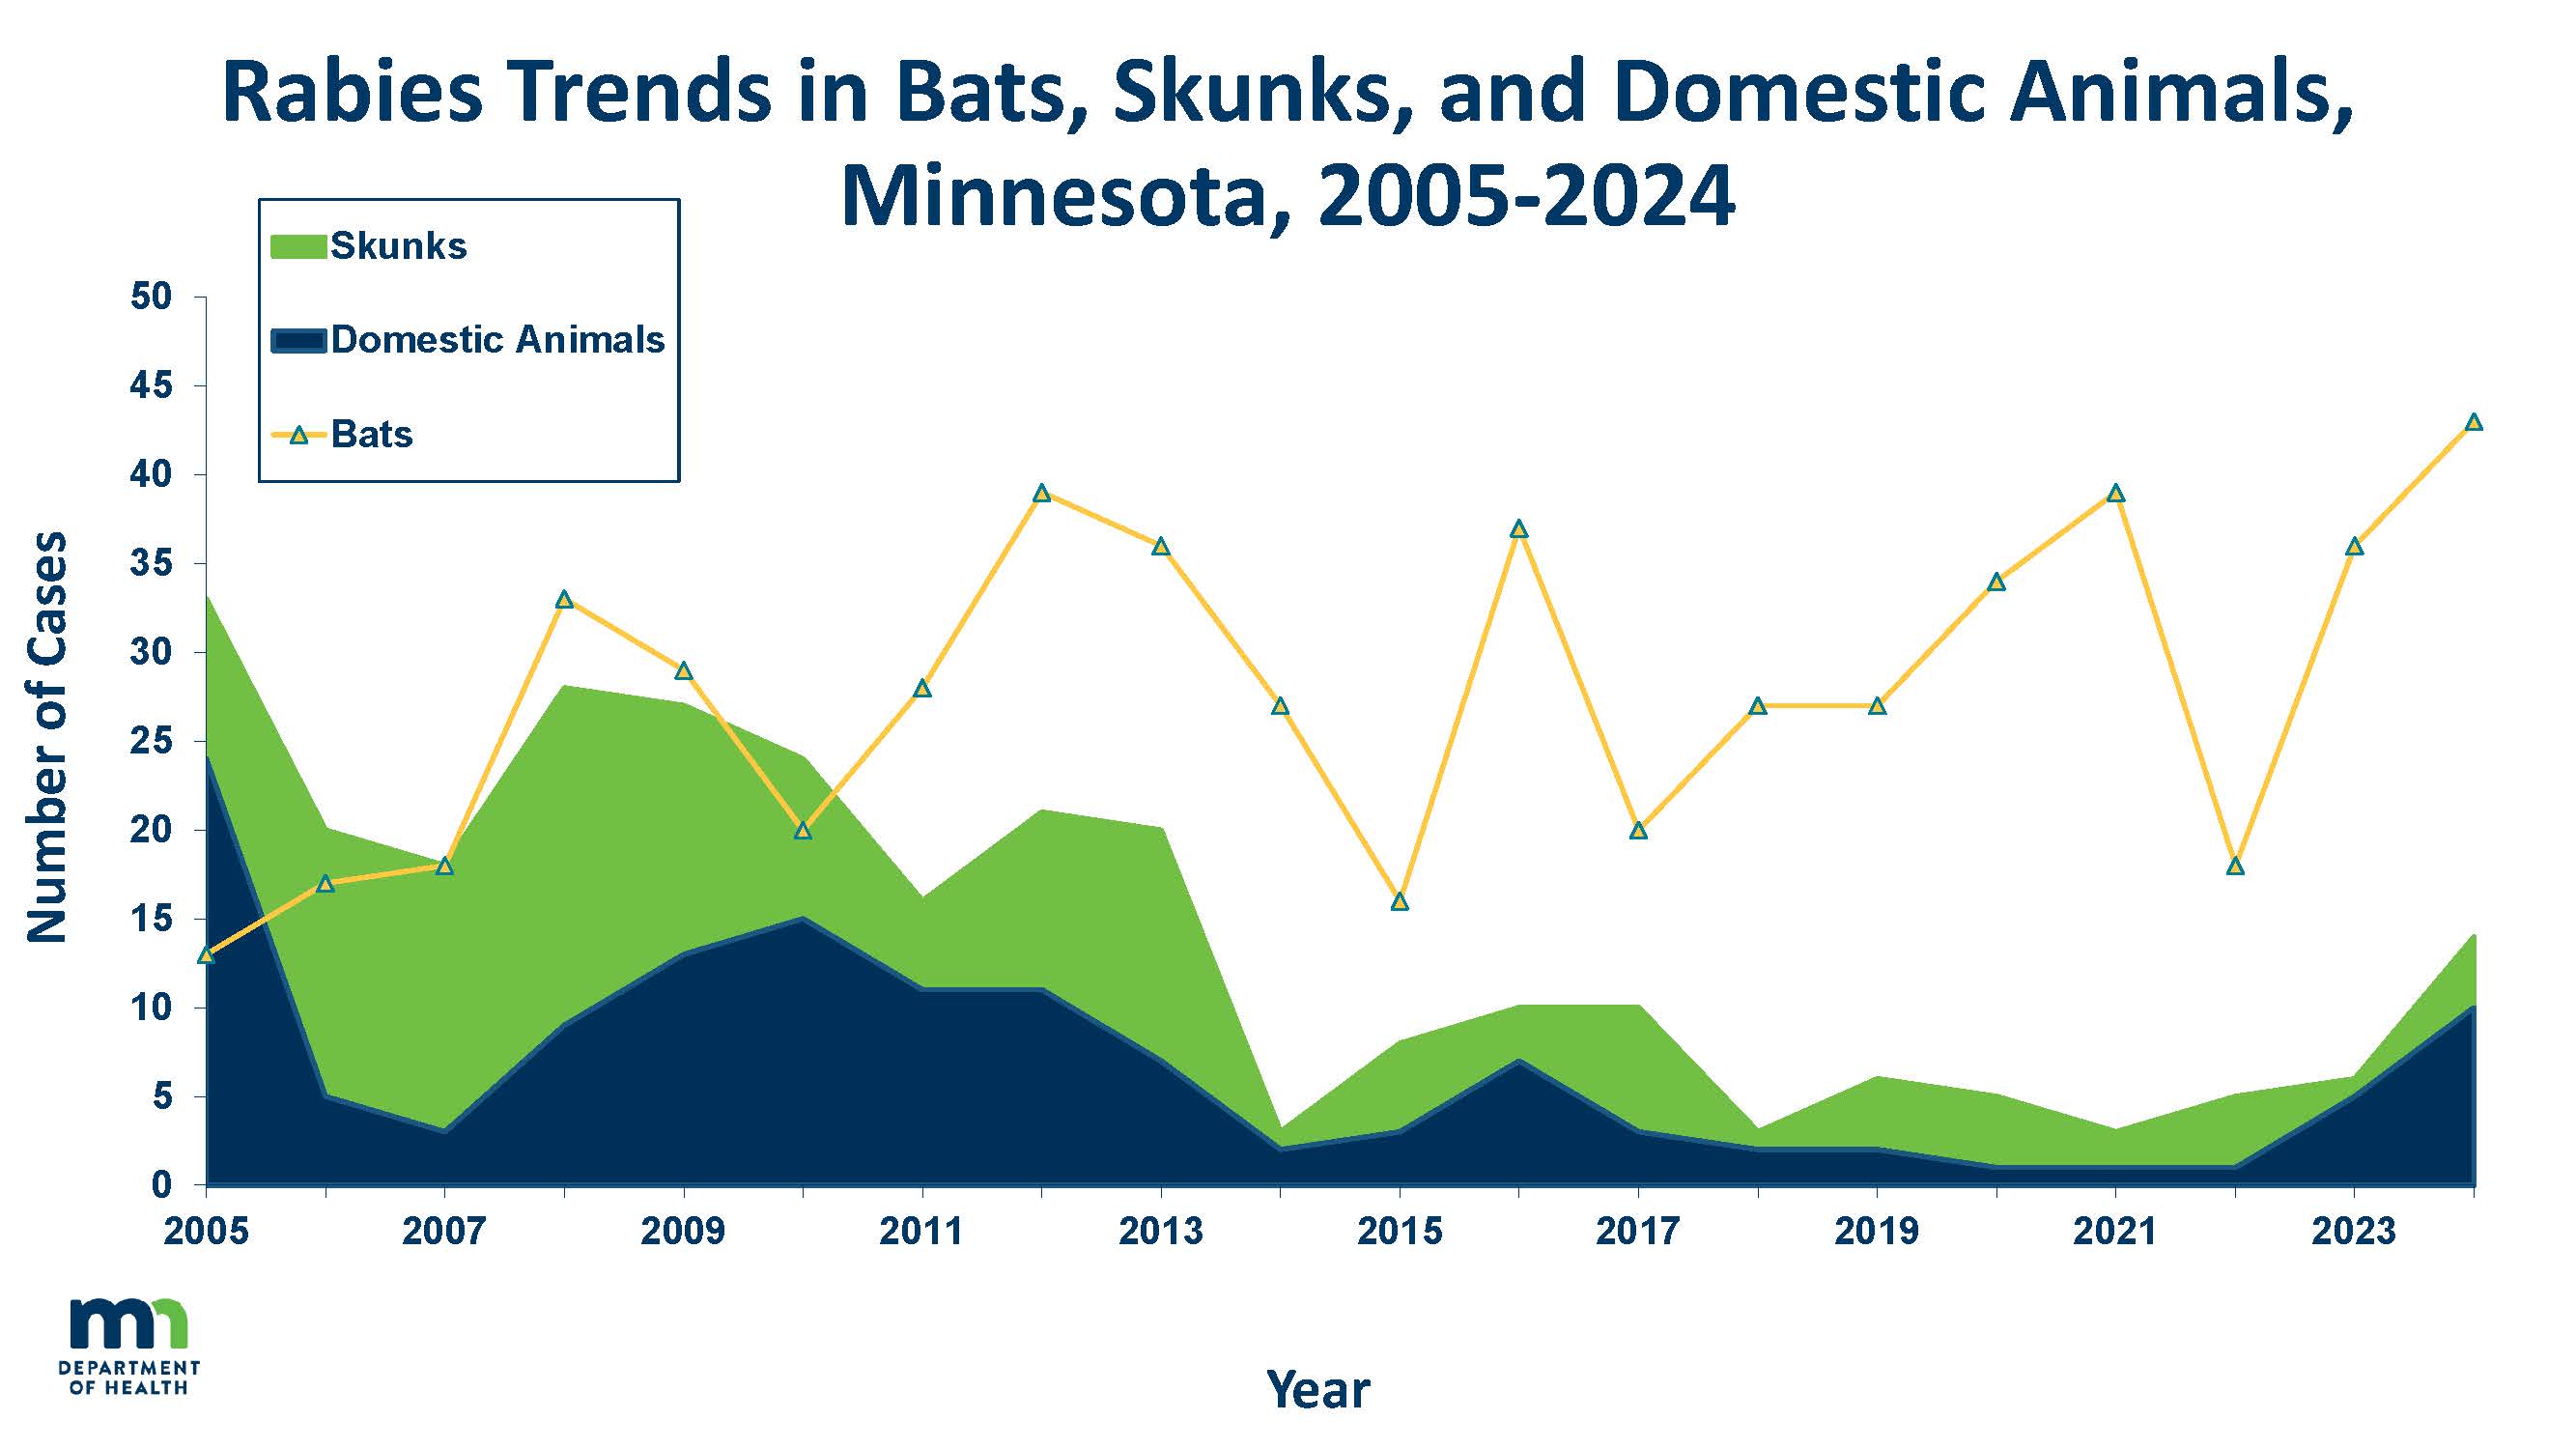 | Rabies Trends in Bats, Skunks, and Domestic Animals, Minnesota, 2005-2025 (PDF) In Minnesota, bats and skunks are the natural carriers of rabies. As rabies levels in skunks drop so do levels of rabies in domestic animals. This happens because most domestic animals get rabies from skunks. |
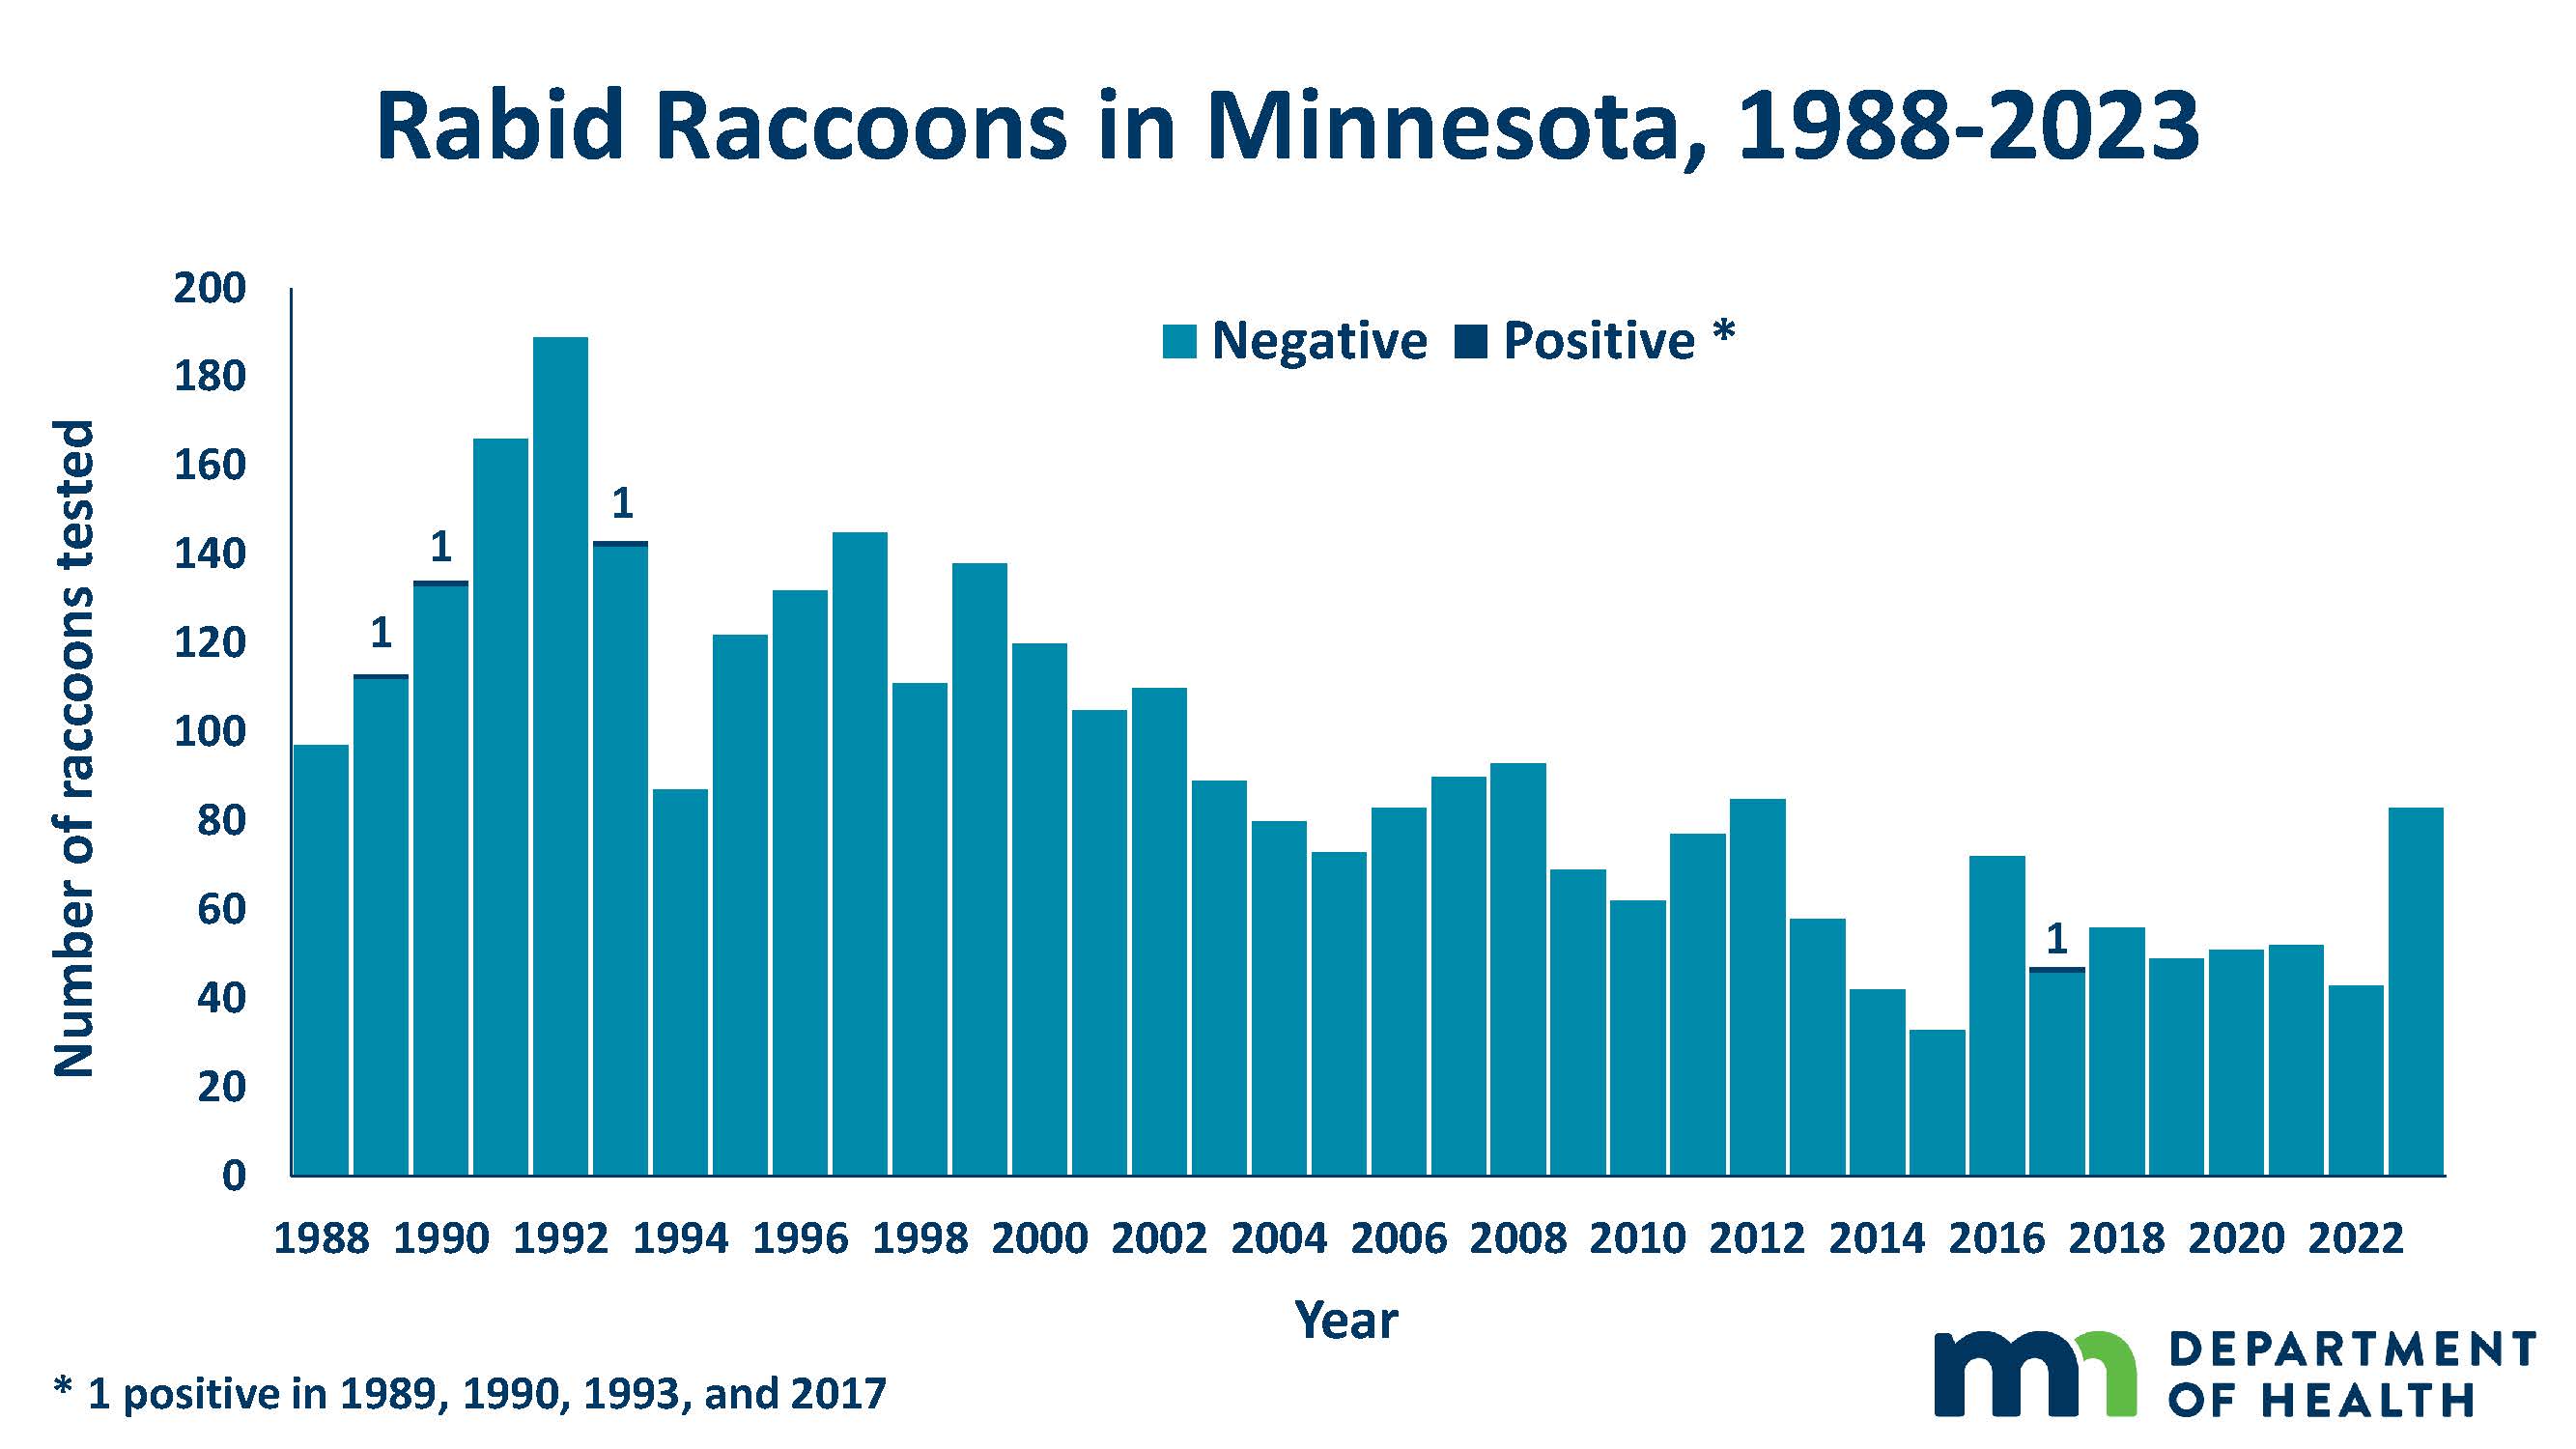 | Rabid Raccoons in Minnesota, 1988-2025 (PDF) Minnesota does not have the raccoon strain of the rabies virus so rabid raccoons are very rare. When a raccoon does get rabies, it has the skunk strain of the virus not the raccoon strain. |
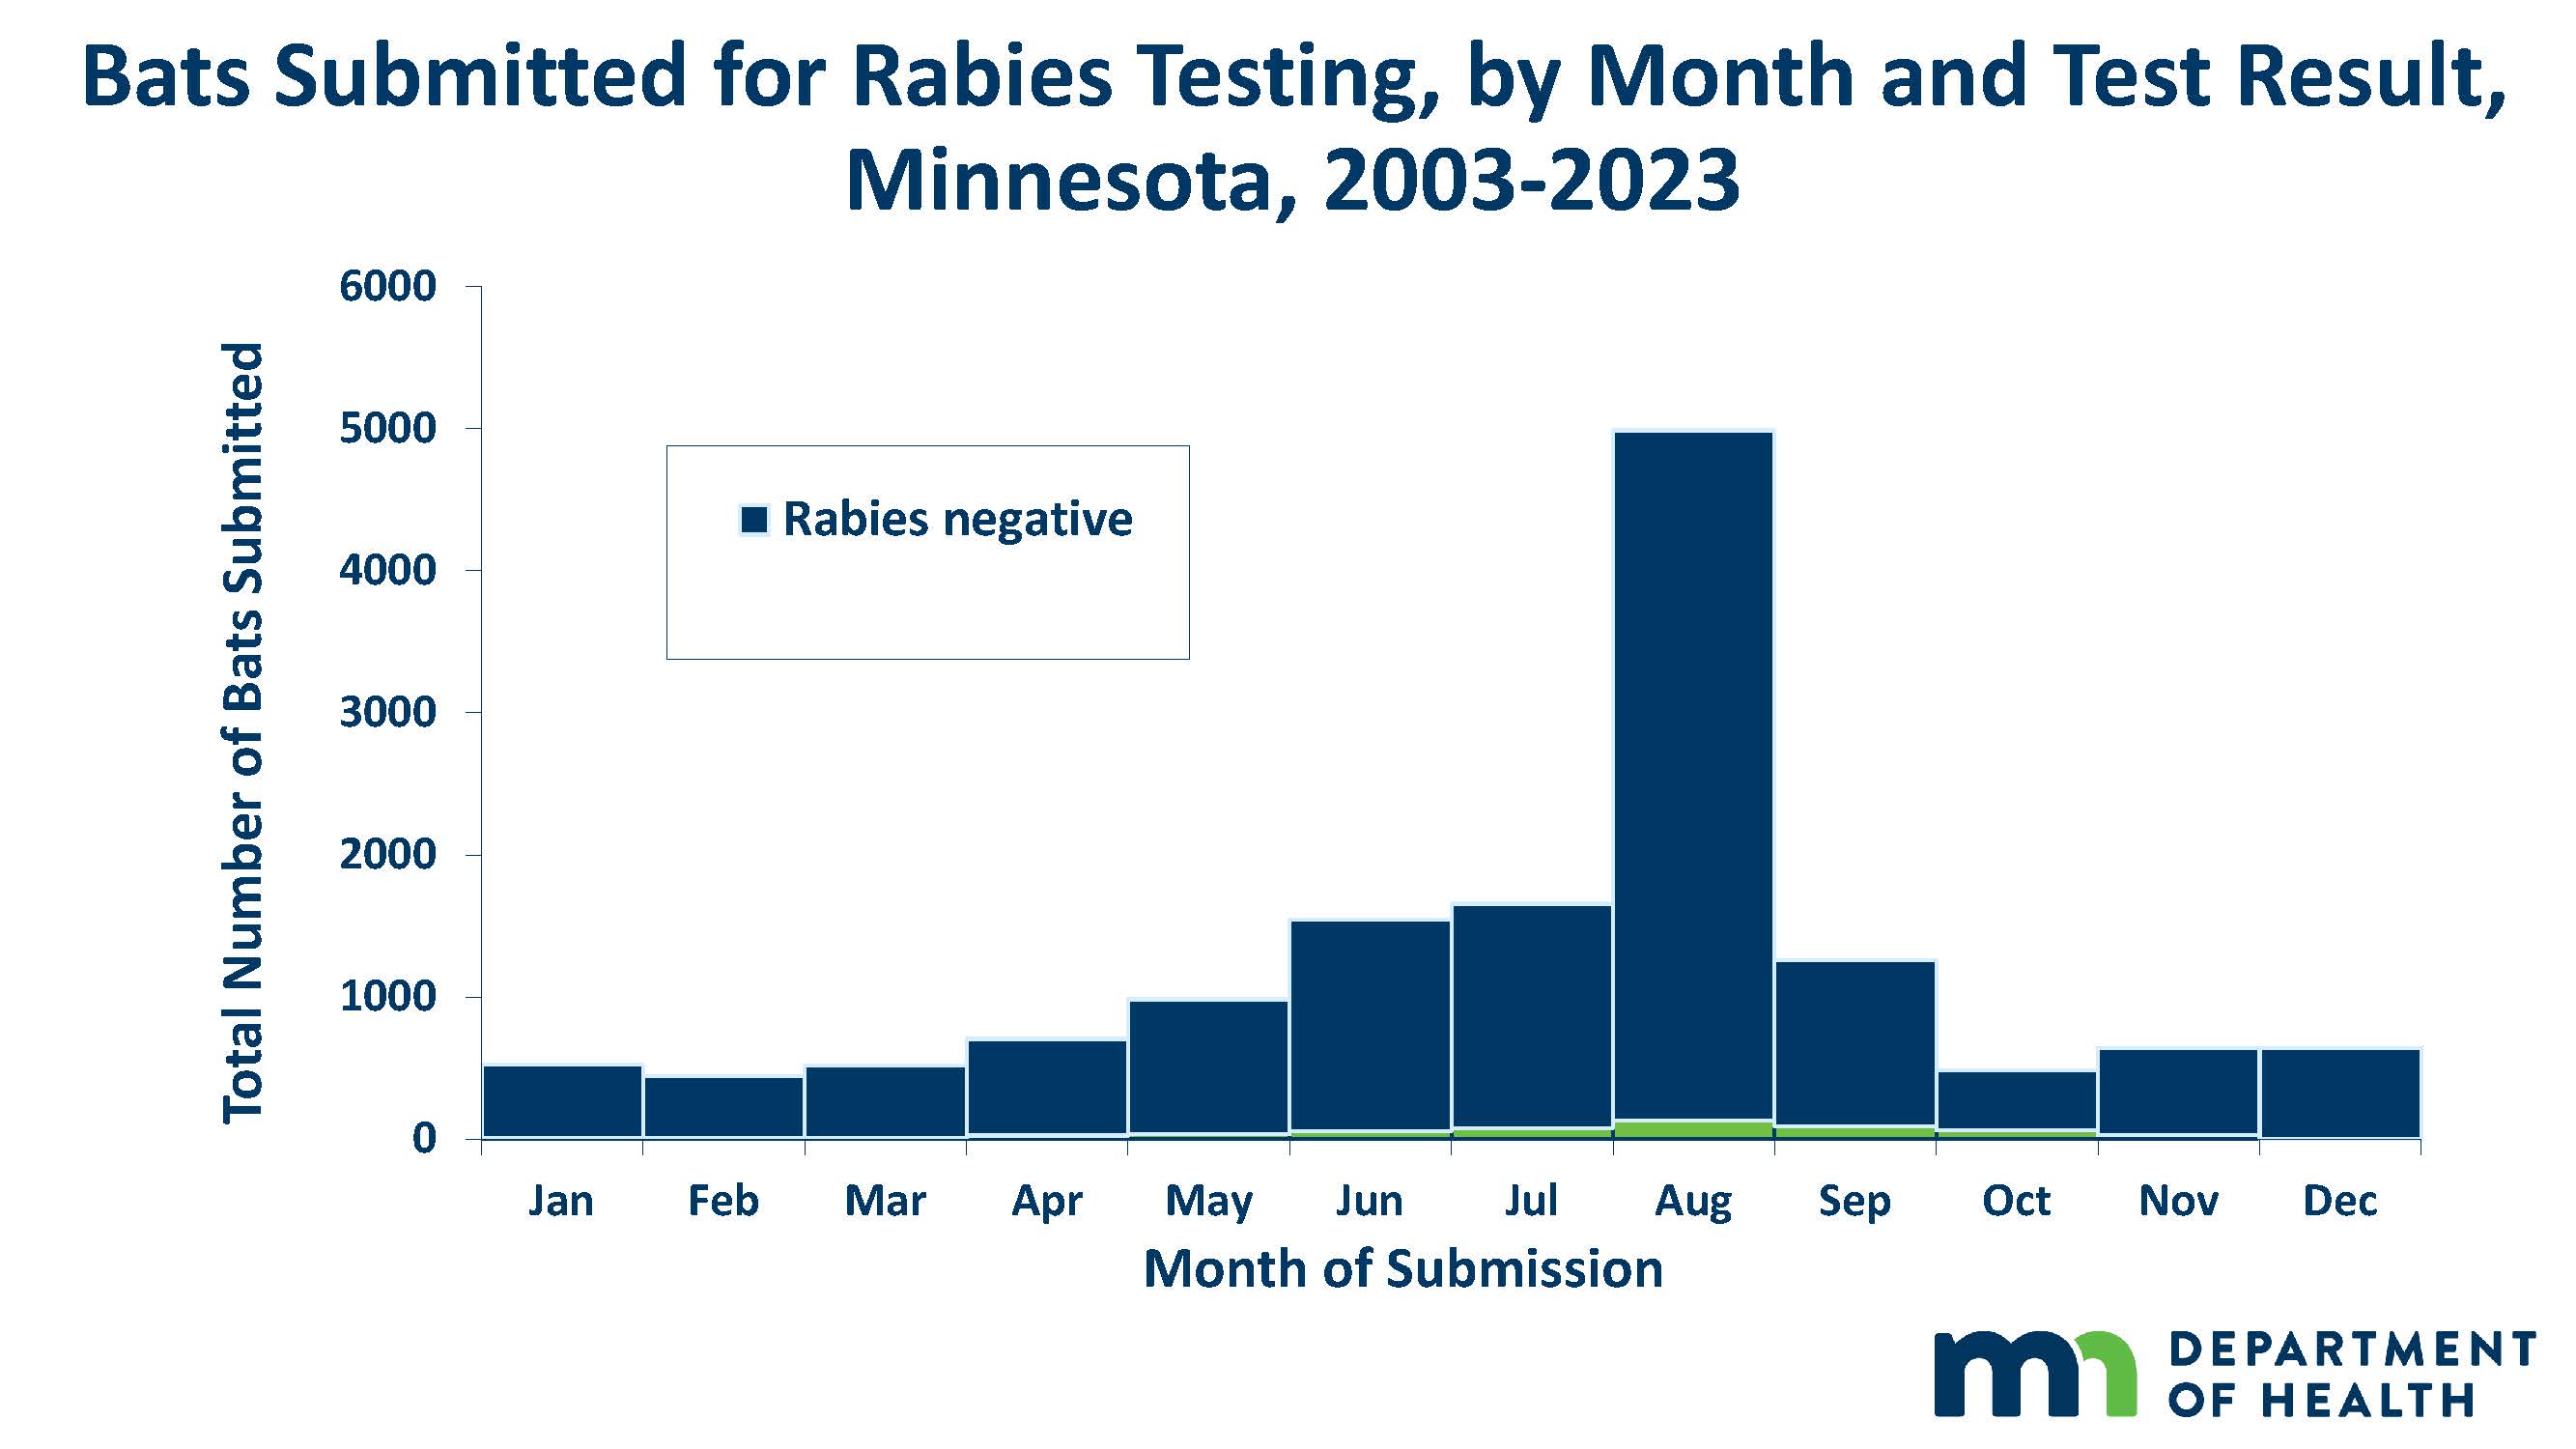 | Bats Submitted for Rabies Testing by Month, Minnesota, 2016-2025 (PDF) Bats are very active in the late summer months as they are preparing for winter, and pups are leaving the maternity roost for the first time thus increasing your chances of having a bat encounter during this time of year. Overall, 4.1% of the bats we tested had rabies. If you have woken up to a bat, had a small child or a vulnerable adult awaken to a bat, or someone had physical contact with a bat, please capture the bat and submit it for rabies testing. |
Maps
Interactive Rabies Map by county jointly produced by MDH and the Minnesota Board of Animal Health.
View the current map at: Rabies Map
Archive of older MDH maps:
- Rabid Animals by County, 2018 (PDF)
- Rabid Animals by County, 2017 (PDF)
- Rabid Animals by County, 2016 (PDF)
- Rabid Animals by County, 2015 (PDF)
- Rabid Animals by County, 2014 (PDF)
- Rabid Animals by County, 2013 (PDF)
- Rabid Animals by County, 2012 (PDF)
- Rabid Animals by County, 2011 (PDF)
- Rabid Animals by County, 2010 (PDF)
- Rabid Animals by County, 2009 (PDF)
- Rabid Animals by County, 2008 (PDF)
- Rabid Animals by County, 2007 (PDF)
- Rabid Animals by County, 2006 (PDF)
- Rabid Animals by County, 2005 (PDF)
- Rabid Animals by County, 2004 (PDF)
- Rabid Animals by County, 2003 (PDF)
- Rabid Animals by County, 2002 (PDF)
- Rabid Animals by County, 2001 (PDF)
- Rabid Animals by County, 2000 (PDF)
- Rabid Animals by County, 1999 (PDF)
Annual Summary Statistics
- Rabies: Annual Summary of Reportable Diseases
The Minnesota Department of Health collects information on infectious diseases for the purposes of determining disease impact, assessing trends in disease occurrence, characterizing affected populations, prioritizing control efforts, and evaluating prevention strategies, and reports statistics annually. Note: There are no listings for years in which there were no cases reported. The annual summary archives available on the web go back to 1997.